Yes.
Currently i am doing a data science training in the evenings after the work, which is all about statistics, python, machine learning, artificial intelligence... meeep... rewind... what was the first lesson?
Yes. Statistics.
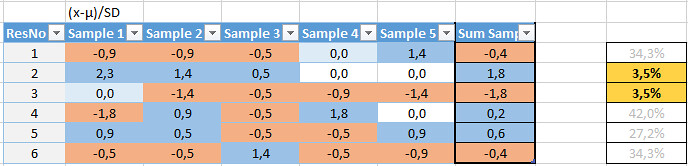
We have to generate a write-up of some data that we generate ourselves as end-project of the first lesson.
I was shifting it to later, because "generating data" is the part that was quite boring.
Now i did it, finally.
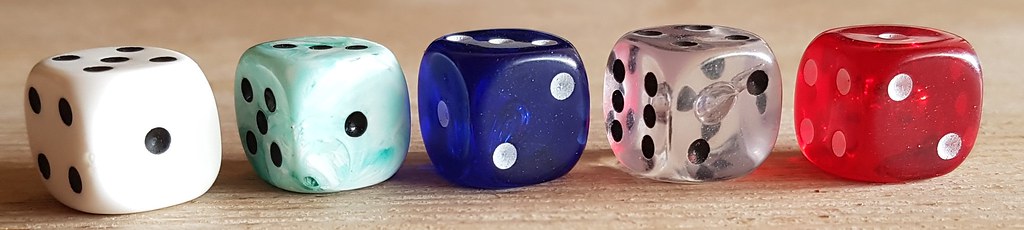
I took the dice tower of Zombicide, put some felt inside because that thing is awfully loud otherwise, and then i rolled five different colored dice, 150 times.
They were white, turquoise, blue, clear and red.
As if that wasn't enough, i repeated the test with 8 of those sets.
Yes it was boring.
Turns out, half of the white dice are broken.
The Turqouise dice are acceptable.
And.
ALL of the Blue, clear and red dice are just broken. Each single one of them prefers one number over some other.
Interestingly, it has nothing to do with weighting. The transparent dice display an air bubble at the corner between 3 and 4, but the defect seems to be independent from that bubble.
How's that possibly on topic with Heroquest?
Well, all those dice were from chessex, with a somewhat flawed production process: They get out of their form, then they get dipped into paint, then they are stonewashed until the mold lines are gone, the paint sticks only in the pips, and they are not straight anymore.
The HQ Dice are not like that. They are made from wood, and the symbols are printed. So i guess there is no dice-destroying stonewashing process involved.
I just came to appreciate another little piece of our game.


 Miniature Exchanges.")
 Miniature Exchanges.")