Page 3 of 3

Re: Boring dice testing

PostPosted: August 30th, 2017, 9:49 am
by whitebeard
By the way, 5 is across from 2. So that die appears weighted to me.

Re: Boring dice testing

PostPosted: August 30th, 2017, 11:40 am
by Anderas
cornixt,

I tried a float test after your suggestion.
What i find is that the side floats on top that was first on top. I can turn the die, he will float with another side on top afterwards.
One exception is, when there it was catching air in the pips, then the side with the air in the pips got up. :)

I tried with three dice that displayed both a beautiful air bubble inside and a skewed distribution. :)


Whitebeard,

yes that one seems to be weighted. Or the five is a little bit round to the outside and the two is a little bit round to the inside. Sadly that was a white die so i can't take easily a photo showing the side deformation like with the colored dice.

I was pondering a bit about your suggestion of calculating more standard deviations.
I found my standard deviation function for a perfect die by letting excel rolling 10 000 000 times the dice with a near perfect randomness and then doing a regression analysis of the results. I would say it's the beginner's method. :lol:
The standard deviation of a normal die should be 0.906 * sqrt(average) whereas the "average" is simply the number of times one side *should* have appeared. So if you roll 6 times, it the average is 1, if you roll 12 times, the average is 2... and so on.

To repeat this for several off-values seems a bit tedious.
Currently i am trying this:

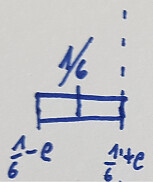
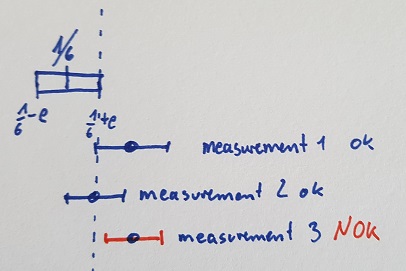
Take the experimental data. If the result is above average, reduce by 5%. If it is below average, add 5%. Then calculate Z like before.
- If the die shows less than 5% irregularity, it looks like a perfect die for the Z calculation
- If t the die shows more than 5% irregularity, it looks like a 5% better die for the Z calculation.

The method has the advantage that everybody may put the threshold where he wants (for example, you on 10%, me on 5%)

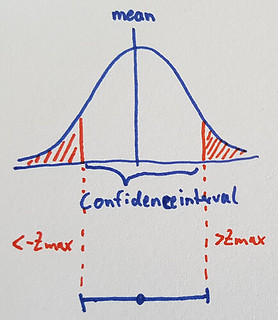
Plus i took your suggestion and used the Z value for a comparison with a confidence interval.
From that interval, i derive the Z Value that is the threshold for "right" or "wrong" and translate it directly to a visible decision on the excel sheet.

Advantage 2, i can enter any confidence intervals i would like.
With 5% failure accepted and 95% confidence, there are 13 dice broken.
With 5% failure accepted and 90% confidence, there are 19 dice broken.
With 5% failure accepted and 80% confidence, there are 28 dice broken.

With 10% failure accepted and 95% confidence, there are 7 dice broken.
With 10% failure accepted and 90% confidence, there are 13 dice broken.
With 10% failure accepted and 80% confidence, there are 19 dice broken.

i am happy with that sheet now.
Now i have to bring it into a publishable format for you guys. I mean. Not that i think you would use it, to be honest. :D

Re: Boring dice testing

PostPosted: August 30th, 2017, 10:17 pm
by whitebeard
I'm not sure I follow the approximation you propose.

From the analytic form for the standard deviation of a discrete probability function, it appears that you can write a simple recursive relationship involving one or more intermediate quantities and compute the standard deviation of 125 consecutive events in linear time. At the very least in O(n^2).

Maybe I'll find the time to work it out. If you dig, you should find it written in a text somewhere.

Re: Boring dice testing

PostPosted: August 31st, 2017, 12:13 pm
by Anderas
Either you use the sample mean and you try to prove that you are staying away from the general mean plus the error,

Or you use the sample mean minus error and you try to prove that you are staying away from the unmodified general mean.

I even made a drawing but that's on my table and I can't be bothered to upload right now. :mrgreen:

Maybe later the evening.

Re: Boring dice testing

PostPosted: September 1st, 2017, 12:22 am
by Anderas
So, here we go.
What's a confidence interval?
Well, you take some measurements, make an average, and then you express that to a certain % you are sure that the real value is in this interval.
That works because if you take measurements and sum them up, they normally start to look like the gauss curve.

Image

It's worth noting that you can use this to compare your measurements to any value in the world and then say "it belongs to it" because it is in the white area or not because it is in the red area.
As i didn't want to draw all the curve each time, i use instead the line on the bottom: The point is my measured mean, and the lines show until where i would say "yes that comparison value belongs to it".

Then we have our value that we want to compare to our measurement.
It is the well-known 1/6 of a die side, plus or minus an error that we want to accept.
Image

You could say, for the right side, we want to compare our measurements to 1/6 plus the error.

That looks like this here
Image

The first two measurements, our reference plus the error was inside the confidence interval, so we mark them as "ok".
The third measurement was outside. So we mark the third as "broken" or "does not belong to it".

So. My point now is that it doesn't make a difference if we compare our measurement to the reference plus e, like in my drawing.
Or if we move our measurements by minus e and then we compare to the original reference.
It works because the confidence interval is made to compare a measurement to really any value you like.

So i am happy with my method now.
Thanks a lot whitebeard, without your comments i wouldn't have gotten here.

Re: Boring dice testing

PostPosted: September 1st, 2017, 9:47 am
by whitebeard
Hmmm... while this seems correct, consider the case where you rolled all 2's. The standard deviation of your sample is zero. So you are 100% certain that the die is loaded. Even if you only rolled 5 times.

The proper method is to use the standard deviation of the boundary case. I can send it later, it is 2 nested "for" loops.

Re: Boring dice testing

PostPosted: September 2nd, 2017, 4:03 am
by Anderas
That would be possible as well, same result: apply the confidence interval to the general mean and compare if this die is inside.

I am done! I think i am as far as i can get in this topic. Now i just need to present it.

If anybody wants to have a die tested, give me the raw data in this format

Number Name,23162546152361235461523

The name is the name of your liking, the number is there in case you have multiple same-ish dice, after this pair is a comma, and then there are only the rolled numbers.

I can enter that format directly into my algo.

Little hint: It doesn't make a lot of sense to use less than a hundred dice rolls. I would use more, like 120-ish. The more you roll, the more it is exact, but on the other side of 240 it starts to lose effect to roll even more.